Monday, January 28, 2013

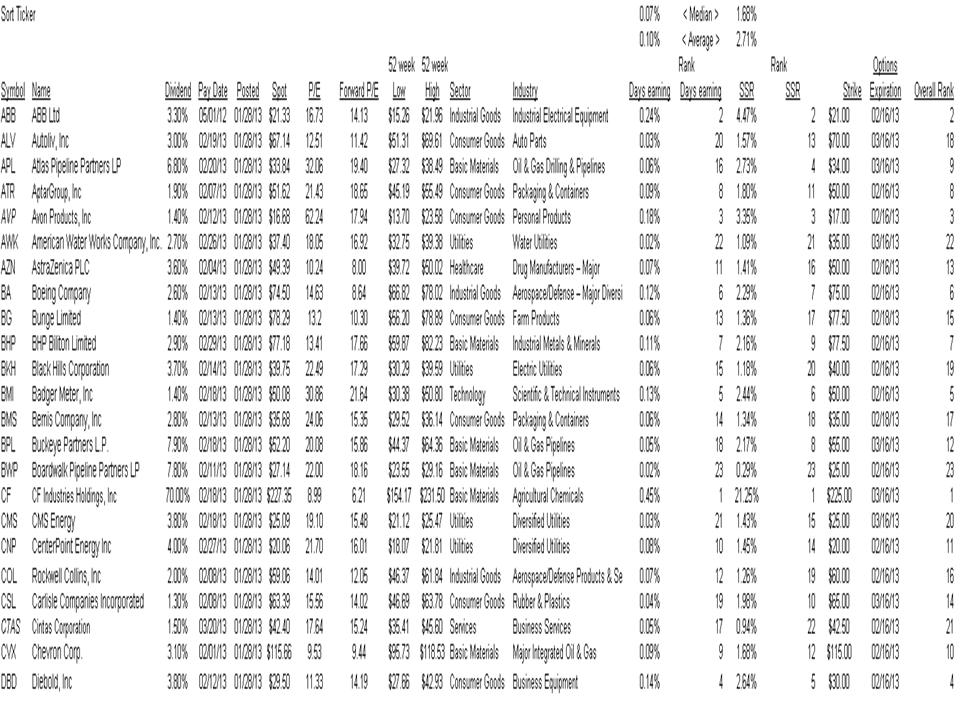
01/28/13 ABB, ALV, APC, APL, ATR, AVP, AWK, AZN, BA, BG, BHP, BKH, BMI, BMS, BPL, BWP, CF, CMS, CNP, COL, CSL, CTAS, CVX & DBD

ABB, ALV, APC, APL, ATR, AVP, AWK, AZN, BA, BG, BHP, BKH, BMI, BMS, BPL, BWP, CF, CMS, CNP, COL, CSL, CTAS, CVX & DBD

How do you eat an elephant?

One bite at a time......

As opposed to doing one elephant of a list we limited the list to a few dozen names and will continue to add posts for February throughout the next few days.

We took positions or traded in those underlined below.


ABB ABB Ltd - Feb 21's are at 55-60¢ not $1.10 - even at 1/2 the premium the trade is attractive.

ALV Autoliv, Inc

APC Anadarko Petroleum Corp

APL Atlas Pipeline Partners LP

ATR AptarGroup, Inc

AVP Avon Products, Inc

AWK American Water Works Company, Inc.

AZN AstraZenica PLC

BA Boeing Company

BG Bunge Limited

BHP BHP Biliton Limited

BKH Black Hills Corporation

BMI Badger Meter, Inc-

BMS Bemis Company, Inc

BPL Buckeye Partners L.P.

BWP Boardwalk Pipeline Partners LP

CF CF Industries Holdings, Inc - as much as we would enjoy a 70% dividend when the typo was corrected to 0.70% the rank changed to 5th Overall, 6th SSR and 5th Days earning.  We still like the stock at 0.70%.

CMS CMS Energy

CNP CenterPoint Energy Inc

COL Rockwell Collins, Inc

CSL Carlisle Companies Incorporated

CTAS Cintas Corporation

CVX Chevron Corp.

DBD Diebold, Inc - top 5 overall - we like this stock


Note: the tables shown are embedded .jpg files. This means that you can: 1) double left click them with your mouse to enlarge them, or 2) right click them with your mouse and choose to open them in a new window or tab, print, save, etc.As with everything we post, we may or may not have the stock and/or strategy in place in any one of our portfolios or may add it at any time. We do not make any buy or sell recommendations. We provide basic analytical research, some short commentary of the results and encourage you to do your own thorough due diligence prior to any purchase or sale.




Thursday, January 24, 2013

Nonsense - why the market is rallying and risk is evaporating

NOTE:  This is a partial posting.  Due to the need to share this information with a client over the web, I released the incomplete posting to allow for sharing of information.  When this note is gone, the final posting will be completed with a conclusion.  Thank you for your understanding.


Nonsense

I have been looking for the answer to the divergence is risk to equity market movements.  Readers will remember how much we look at the VIX and value it as a took to manage risk and an indicator of investor pricing of risk.  However, the VIX has been declining for quite a while.

30 day VIX graph


90 day VIX graph
Note the "Fiscal Cliff" spike at the end of December and subsequent collapse or the index that represents risk.


 1,825 day/5 year VIX graph
The above 5 year graph shows a pattern of lower highs and stable lows until this months collapse.  Seems like a technical traders dream.

So I downloaded some data and took a closer look at it.


The above chart is the closing price of the S&P 500 charted against the closing price of the VIX for the past 5 years.  The correlation coefficient for this period is -74, not an insignificant number.  The inference I took from this was that as the market moved, the risk premium followed in the opposite direction.  There did not appear to be any indication of one data set leading the other.  .


Tuesday, January 8, 2013

01/08/13 - Why go long now?

Why go long stocks now?

We discussed this very question today as we began to execute the BIG list on the last post.  The following chart looks awful but is a great technical justification for buying.

The scale for the two indices is awful.  But it is a quick and dirty chart that shows as the VIX declines the S&P500 increases.  Statistical analysis aside, it serves to support a buy posture.  Certainly we have written how emotions and beliefs cannot guide us.  We are professional investors.  Although the daily news seems awful and causes us to doubt investing, quantitative analysis helps keep us on track.

The VIX is an indication of risk or fear of risk.  As risk fears decline the premium on the index declines.  Thus market volatility or price uncertainty and "sketchy" behavior should decline.  This is in no way a certain indicator of the future market direction.  We did not need to do extensive statistical analysis to determine market direction.  We have little interest in a market that increases or decreased in value.  We make our money on capturing dividends and premium.  The best market for us is a sideways or static market.  No doubt we would like an upward trending market, but it does little for except make the overall market investors feel good. It is nice to feel good, but only as a confidence booster.  Our responsibility is to keep our eye on the prize and work hard to meet our clients expectations.

Other reasons to own stocks:
Earnings are near historic highs!  Now I do believe there is inflation out there, however, we are in a massive recession and earnings are outrageously high.  Seems like some politician will want to smack corporations with more taxes.  Too bad dividends are paid after corporate taxes are calculated then the precipitant if they are subject to dividend tax also pay tax on their income.  Thus the old double taxation argument..