You investors are a fickle kind; rather you speculators in investors clothing. Markets go up and markets go down. I was once asked, "Why would you invest in a Bear Market?" My response, "Tell me a day ahead of time then the Bull Market begins and I'll wait." Well, things are not always as easy as they seem. I was working hard the past few days to establish positions to put to work money. The available investable cash was from called stocks or expired options. Yesterday (August 31, 2010), my colleague thought I was crazy as everybody thought the market was collapsing. Today (September 1, 2010), I could not move fast enough as everybody thought the market was rallying. What to do?
The quote above is from a cartoon I cut out decades ago. It was as funny then as it is now. If you do not understand irony, well…… there is a man who is always shouting about stocks on the TV and you should be watching rather than reading this commentary.
We investors are a rare and funny (curious rather than humorous) group. We have patience and usually operate in a vacuum. We use quantitative things like math and analysis, ignoring qualitative things like sentiment and investor momentum. We like information and data but have the courage of our convictions because win, lose or draw we understand why we do what we do and believe in our process. Let us look at some economic and market indicators that I believe are useful to our cause. These are what I like to call bedrock data. They are not subject to revision, have long histories and are generally accurate. Do not get me wrong I do look at the weekly, monthly and quarterly data series. However, the more subject to revision a number is the less I value it. The weekly unemployment numbers certainly fall into this category. How hard is it to count unemployment claims? Apparently, our government has its issues with this task. Although they pay the claims, they never seem to know how many people they pay. The revisions always seem to be more telling than the headline numbers. The explanations sometimes read like a Joel McHale routine. Anyway, let us look at the indicators we hold in high esteem, 1) Capacity Utilization, 2) Commodity Prices and 3) Credit Spreads.
1) Fear and panic create opportunity. We cannot always understand why things happen. A popular quote on my old trading desk when asked why the markets were up or down was, “an imbalance of buyers to sellers” (or vice versa). Economic indicators tell you what happened. There are some “forward” indicators but most of these are ignored. As a newly minted analyst, I was introduced to Capacity Utilization. This is a wondrous statistic. Mostly because it is useful. Certainly, the underlying data can be suspect, albeit no more suspect than any other bit of data. The Capacity Utilization data is provided by the Federal Reserve as part of the monthly from the monthly G17 report that is headlined by Industrial Production. What is so genuine about Capacity Utilization is that this number and its components is its innocent nature. It is simply the percentage use of productive capacity by facilities involved in manufacturing, mining, and electric and gas utilities. This pretty much covers everything involved in making stuff. Headline readings above 82% are great and below 75% are bad. The recent past and current readings are worse than bad. For fun, I suggest looking at the series and analyzing some afternoon. But only with a loved one to show them how much you truly care. It is an amazing data series and I hope you find it as telling, rewarding and fulfilling as I do. (web link: http://www.federalreserve.gov/releases/g17/current/default.htm ).
2) Commodity prices from the cost of food at the grocery to gold futures. The less influenced by the traded markets a commodity price is the better the indicator. Everybody eats food. The type of food is the variable. Mac-n-cheese has become popular, as has bottled water. Mac-n-cheese represents a financial decision while bottle water represents a fashion decision. Keep to the financial decisions. Gold prices are high and trending higher. The price movement has many factors. Including fear of inflation and safety. Gold is an inflation hedge because it is a store of wealth and can easily be converted to cash and less easily be stored and transported. SPDR’s represent an easy way to own gold with lower transaction costs and greater portability. GLD is our poster child and it has a full array of options (the kind we like to trade) behind it. Energy prices for the most part are silly to look at because speculators and hoarders skew their supply demand characteristics (ie: oil). Looking at industrial metals like copper and silver provide a more down to earth view. By the way, the view is not a good one. Industry needs metals to operate. Ore’s are cooked, melted and pounded into stuff people buy. This stuff is a big component in our GDP or the key measure of economic growth. Price charting is helpful although there are price influences that do not always appear and a little history helps. Keep in mind that beef and corn food prices were forced up by the ethanol fiasco, platinum and palladium are hedges against each other and natural gas is seasonal (cheap, abundant and odorless - methane from living organisms excluded).
3) Finally, the credit markets are another great economic/risk indicator. Keys to the understanding risk pricing are: yield spreads, the value of a basis point and forward pricing. Yah, right, I am not going to explain these but provide just enough information to tease you and make you dangerous. The levels/amount of spreads is the easiest to look at but as with all else, there are deeper indicators that are frankly damned hard to understand. The levels/amount of spreads is the differences between yields on credit/corporate bonds to government bonds from over night to 30 years. Changes in the levels are a simplified indicator of investor risk appetite. When the spread difference from corporate bonds to government bonds is wide, things are bad. Speculators especially, and when things are really bad investors, sell risky assets (Corporate bonds) to buy safe assets (Government bonds). When there is a crisis, everybody runs to the cover of the dollar and US Government bonds. All the foolish talk about US Government’s poor credit is mostly nonsense (when investors start buying Chinese Government bonds the risky US Government bond argument may begin to make sense). Things are going to get a little complicated in the explanation at this point. Read the next part slowly and thoughtfully, it is really truly geeky technical interest rate risk stuff but invaluable in understanding how risk is priced. As always, I will be happy to provide more information if you ask (just e-mail me at addingalpha@consultant.com ). While the quick and dirty current risk assessment above is the absolute spread in yield, the yield on one bond minus the other, is important it is not as important as the value of each basis point in the spread. This is based on a technical measure called the value of a basis point (0.01% of yield). It is related to a derivative of price sensitivity measure called duration. Duration is a measure of price sensitivity based on the maturity, yield and interest rate of a bond. Since this is the concern of geeky bond people, I will not go into any detail except to tell you it is a very important measure of price sensitivity and becomes more valuable as yields decline. Think of it in simple common ration terms: if prices increase $1 it is more meaningful when the original price is $1 than if it was $100. A move from $1 to $2 is a 100% increase while a move from $100 to $101 is a 1% increase. The same absolute $1 increase in price is significantly more meaningful when prices are low than when they are high. The same is true for a 0.01% price change in bonds. All this being said the yield difference between corporate bonds and government bonds is wide on a yield difference basis and the value of each basis point of yield – this is a real danger sign. Finally, the forward yield curve is conceptually easy, if you have a PHD in math. Basically, it is shifting the term structure of interest rates, aka yield curve, forward. If we look at a graph of interest rates made up of yields on the y-axis (vertical) and maturity on the x-axis (horizontal) we have a yield curve. Using some math we can simulate what the price of any given interest rate will change to if we move forward in time. Let us use 1 year forward in time. Therefore, today’s 2-year bond becomes a 1-year bond; the 5 year becomes 4 years, on and on. We know how what the 1 year forward price is? We use formulas designed by some really smart, and possibly lonely people, figured out how to use today’s prices to predict the forward price of a bond. The formulas use yield change calculations, duration adjustments, income payments, convexity (another key indicator and is related to the behavior of price movements), etc. to figure out what the forward yield curve would look like. This is similar to our stand Still Rate (SSR) but takes a whole lot more work to calculate. The results are not always what you would expect and the exercise can be very telling as to where investors think interest rates are headed (do not think that bond invertors actually do this – it is the realm of the back room guys who do not always get the respect they deserve). This information can be found on the web but for now, we will know this exists and focus on it at a later date.
Quick note: Point to praise a brilliant analyst. Stanley Dillar, a true genius, has written extensively on the subjects of duration and convexity. I was fortunate enough to have met him in the late 1980’s at a conference. Dillar operates at a level most investors try to avoid. Google his name and if possible read his work. It is well worth the effort. The following blog is an excellent review of his methods: http://webcache.googleusercontent.com/search?q=cache:BDQj2TASeKIJ:alephblog.com/2009/12/23/my-tips-treasuries-and-inflation-model/+stanley+diller+bear+stearns&cd=5&hl=en&ct=clnk&gl=us
I mention the three chosen indicators above, Capacity Utilization, Commodity Prices and Yield Spreads for a reason. These three indicators are priced nearest to action. Capacity Utilization reflects what people who are operating businesses are doing at this moment, Commodity Prices reflect the costs of doing business
Tuesday, August 31, 2010
Monday, August 30, 2010
08/29-30/10 Let’s make some progress on the list!
Let’s make some progress on the list! ABT, AFL, APD, APL, ADP, ETP, CVX, EDP, GLD, JNJ, KMB, PG, PH, KO, SMG, STR, SYY, UVV, TYC
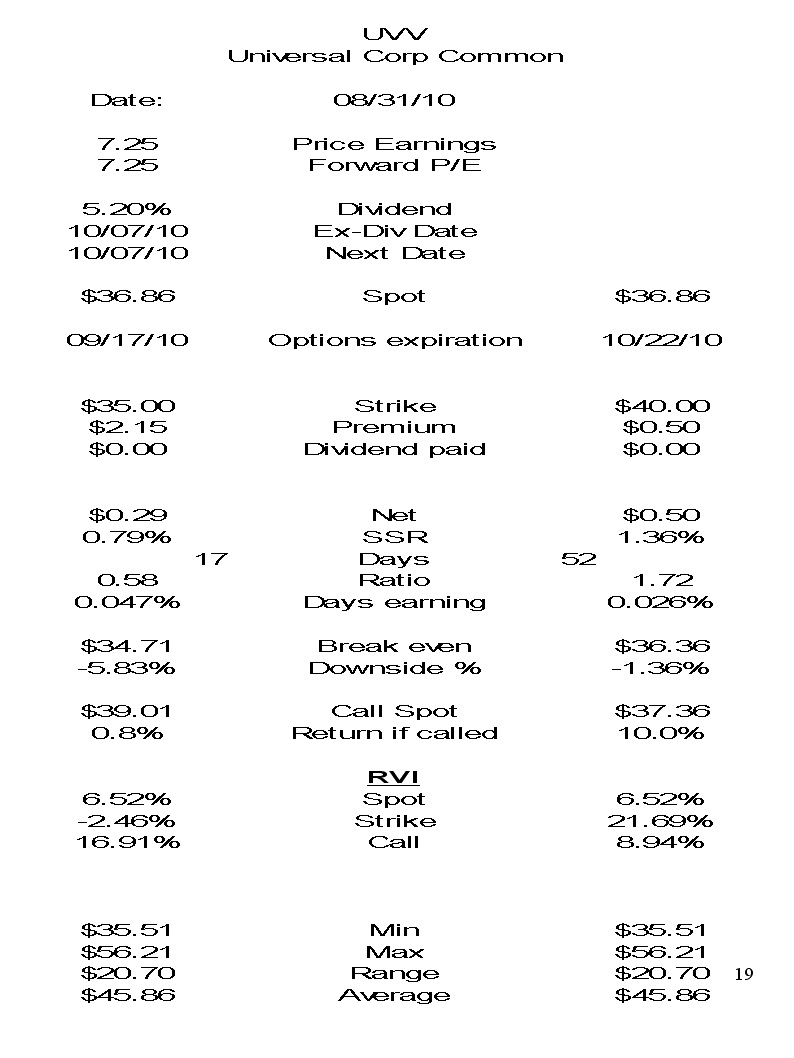
Keep in mind that each day that goes by, the value of short term options change. The key components for options pricing are: time, strike and volatility. We can only control two of these components, time and strike. I know someone is thinking – HE IS WRONG THERE ARE SOOO MANY MORE THINGS YOU CAN ADD! Let us keep in mind that we can nuance these conversations to death. The goal is to stick to the KISS theory – Keep It Simple Stupid. With that thought you will notice a few changes to the way I am presenting the ideas below. The column format has been added for side-by-side comparison. With rare exception I show two scenarios, usually using the same strike with one the current month and the other the next month out. I have added Ration, this is the ratio of the one premium to the other. This is a quick and dirty value analysis where I simply divide one value by the other. When the ration of the scenario on the left is 2 or more it represents a better value. The Days earning is simply the Stand Still Return (SSR) on the option divided by the days to expiration. It is expressed in basis points. The biggest change is the addition of the RVI. RVI stands for Relative Value Indicator.
RVI is a relatively simple formula that shows position of the value indicated (Spot, Strike, Call) to the stocks 52 week trading range. Honestly, as a total return value manager it should be meaningless. If I like a stock I like a stock. However, the technician in me rises up and I want something to indicate rich/cheap on some level. It is really another potential red flag indicator to make me think again about the risk on investing and challenge my confidence and convictions.
Here is the analysis:
*Note: the tables shown are embedded .jpg files. This means that you can: 1) double left click them with your mouse to enlarge them, or 2) right click them with your mouse and choose to open them in a new window or tab, print, save, etc.

Risks –This is a pharmaceutical - there are always potential risks of product liability, etc, etc.

Risks – Insurance companies have their own risk profiles as do all industries. The crazy goose could go psycho but the real risks are premium pricing and competition. It is so easy for consumers to switch providers on line. The convenience is incredible. However, as with so many things people tend to pay the bill and move on. Furthermore, we are short term and it is very unlikely a major shift to customers would happen is such a short time.

APL is the only stock that I have included three option scenarios, one for September and two for October. October did not offer the $17.50 strike so I showed the strike prices on either side, the $17’s and $18’s. The RVI’s are very high. The stock price range for 52 weeks is $5.50 to $18.80 with the spot at $17.25. As I mentioned above the technician in me comes out and this is a perfect example. The return profile is so attractive, however, the price relative to its historic range is high. The downside breakevens are generous, 2.9-7.25%. I like the industry as I have a bias for tolling fees and annuity income. I believe this is an inherent bias when seeking dividends. I do have my concerns but the payouts are so attractive.

Risks – As with APL, the annuity income is desirable. The RVI’s are reasonable and the SSR;s are high. We will capture a dividend, however the amount of dividend is in question. If it is maintained at 3.5% the return contribution is 0.88%. Not bad.

Risk – the overall SSR is low. However, the stock is high income and again has the kind of stuff an income manager has to like.

Risks – The overall industry is having its “issues”. Agree or disagree with the problems there are a few things that make sense: oil is here to stay for a while, the cost for the sector to do business has/will increase, they are in a oligopoly industry with huge barriers to entry. Failures are expensive and cost shareholders.

Risks – Again a service industry stock. This series of stocks has a lot of energy related participants. The risks are shared without regard to their contributions. EPD has relatively high P/E’s and high RVI’s.

Risks – This is one of the areas where we bend the rules. Commodities as inflation hedges in this environment are key. Without getting into a long dissertation on inflation and the indicators raging toward double digit’s, we like gold a lot. There is no dividend paid on the SPDR’s. What we have found is the pure play on gold is better than taking exposure through gold stocks. There are few true gold stocks and they all come with their issues. Be it ADR characteristics, management or other factors the pure play is often the best. The SSR is high as is the RVI.
 alt=""id="BLOGGER_PHOTO_ID_5511540504547338754" />
Comment: Second largest member of the stable/consumerb goods sector. JNJ is a perennial favorite.

Comment: Smallest member of the stable/performing sector of consumer goods.

Comment: Largest member of the stable/performing sector of consumer goods.


 alt=""id="BLOGGER_PHOTO_ID_5511540194347925778" />


Comment: Note the SSR improves dramaticaly going out one months with the same strike price. The RVI is very low. We like energy companies especially these with mid stream capabilities and natural gas exposure like STR. STR is a small player in a market dominated by giants. they offer a nice dividend and their price appears to be depressed by association.

Comment: Food is good and they supply it and related services. Overall their is excellent, high SSR, low RVI and a dividend to be paid at the end of September. Note that the options have two different months and strike prices.

Comment: UVV recently fell back to earth after stellar performance. It is hard not to like the 5%+ dividend. The options premiums are ok but gathered up with the
low RVI and high dividend it is attractive.

Comment: TYC seems to have always delivered with high volatility (options pricing component & stock price). We have been active with this stock for years and it has never disappointed although its management has. It is the junior player in a sector of dissimilar competitors. We like the annuity components of its business. The SSR is all around good.
Keep in mind that each day that goes by, the value of short term options change. The key components for options pricing are: time, strike and volatility. We can only control two of these components, time and strike. I know someone is thinking – HE IS WRONG THERE ARE SOOO MANY MORE THINGS YOU CAN ADD! Let us keep in mind that we can nuance these conversations to death. The goal is to stick to the KISS theory – Keep It Simple Stupid. With that thought you will notice a few changes to the way I am presenting the ideas below. The column format has been added for side-by-side comparison. With rare exception I show two scenarios, usually using the same strike with one the current month and the other the next month out. I have added Ration, this is the ratio of the one premium to the other. This is a quick and dirty value analysis where I simply divide one value by the other. When the ration of the scenario on the left is 2 or more it represents a better value. The Days earning is simply the Stand Still Return (SSR) on the option divided by the days to expiration. It is expressed in basis points. The biggest change is the addition of the RVI. RVI stands for Relative Value Indicator.
RVI is a relatively simple formula that shows position of the value indicated (Spot, Strike, Call) to the stocks 52 week trading range. Honestly, as a total return value manager it should be meaningless. If I like a stock I like a stock. However, the technician in me rises up and I want something to indicate rich/cheap on some level. It is really another potential red flag indicator to make me think again about the risk on investing and challenge my confidence and convictions.
Here is the analysis:
*Note: the tables shown are embedded .jpg files. This means that you can: 1) double left click them with your mouse to enlarge them, or 2) right click them with your mouse and choose to open them in a new window or tab, print, save, etc.

Risks –This is a pharmaceutical - there are always potential risks of product liability, etc, etc.

Risks – Insurance companies have their own risk profiles as do all industries. The crazy goose could go psycho but the real risks are premium pricing and competition. It is so easy for consumers to switch providers on line. The convenience is incredible. However, as with so many things people tend to pay the bill and move on. Furthermore, we are short term and it is very unlikely a major shift to customers would happen is such a short time.

APL is the only stock that I have included three option scenarios, one for September and two for October. October did not offer the $17.50 strike so I showed the strike prices on either side, the $17’s and $18’s. The RVI’s are very high. The stock price range for 52 weeks is $5.50 to $18.80 with the spot at $17.25. As I mentioned above the technician in me comes out and this is a perfect example. The return profile is so attractive, however, the price relative to its historic range is high. The downside breakevens are generous, 2.9-7.25%. I like the industry as I have a bias for tolling fees and annuity income. I believe this is an inherent bias when seeking dividends. I do have my concerns but the payouts are so attractive.

Risks – As with APL, the annuity income is desirable. The RVI’s are reasonable and the SSR;s are high. We will capture a dividend, however the amount of dividend is in question. If it is maintained at 3.5% the return contribution is 0.88%. Not bad.

Risk – the overall SSR is low. However, the stock is high income and again has the kind of stuff an income manager has to like.

Risks – The overall industry is having its “issues”. Agree or disagree with the problems there are a few things that make sense: oil is here to stay for a while, the cost for the sector to do business has/will increase, they are in a oligopoly industry with huge barriers to entry. Failures are expensive and cost shareholders.
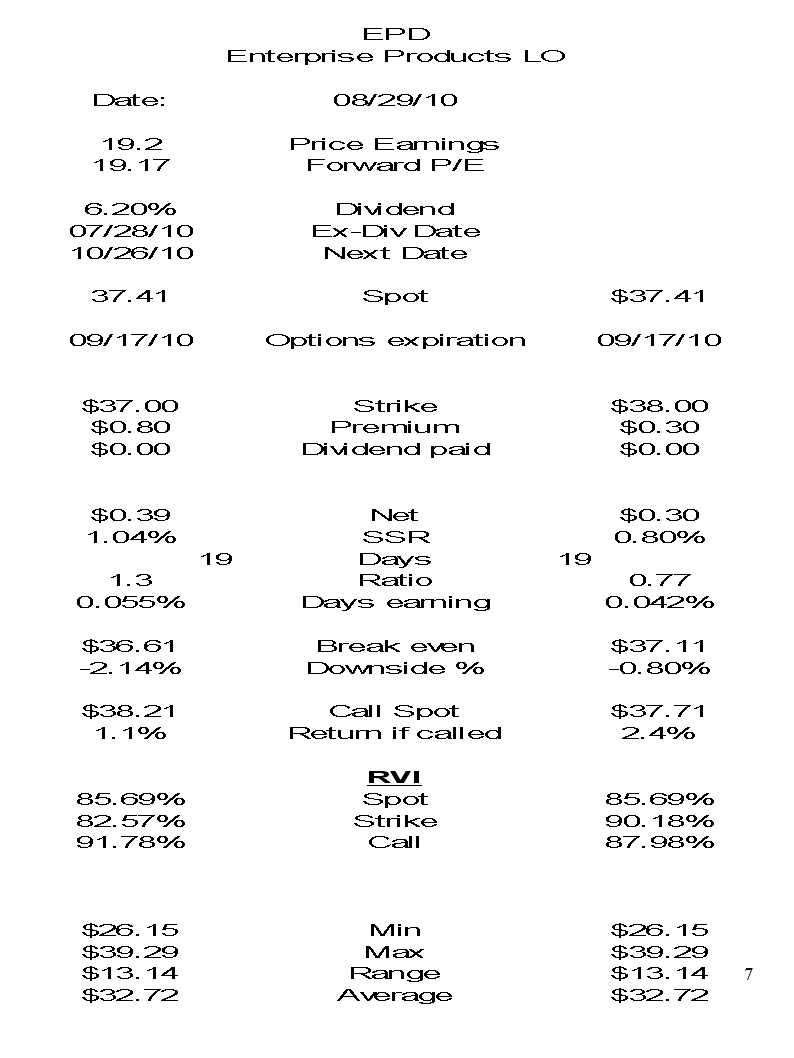
Risks – Again a service industry stock. This series of stocks has a lot of energy related participants. The risks are shared without regard to their contributions. EPD has relatively high P/E’s and high RVI’s.

Risks – This is one of the areas where we bend the rules. Commodities as inflation hedges in this environment are key. Without getting into a long dissertation on inflation and the indicators raging toward double digit’s, we like gold a lot. There is no dividend paid on the SPDR’s. What we have found is the pure play on gold is better than taking exposure through gold stocks. There are few true gold stocks and they all come with their issues. Be it ADR characteristics, management or other factors the pure play is often the best. The SSR is high as is the RVI.
 alt=""id="BLOGGER_PHOTO_ID_5511540504547338754" />
Comment: Second largest member of the stable/consumerb goods sector. JNJ is a perennial favorite.

Comment: Smallest member of the stable/performing sector of consumer goods.

Comment: Largest member of the stable/performing sector of consumer goods.


 alt=""id="BLOGGER_PHOTO_ID_5511540194347925778" />

Comment: Note the SSR improves dramaticaly going out one months with the same strike price. The RVI is very low. We like energy companies especially these with mid stream capabilities and natural gas exposure like STR. STR is a small player in a market dominated by giants. they offer a nice dividend and their price appears to be depressed by association.

Comment: Food is good and they supply it and related services. Overall their is excellent, high SSR, low RVI and a dividend to be paid at the end of September. Note that the options have two different months and strike prices.
Comment: UVV recently fell back to earth after stellar performance. It is hard not to like the 5%+ dividend. The options premiums are ok but gathered up with the
low RVI and high dividend it is attractive.

Comment: TYC seems to have always delivered with high volatility (options pricing component & stock price). We have been active with this stock for years and it has never disappointed although its management has. It is the junior player in a sector of dissimilar competitors. We like the annuity components of its business. The SSR is all around good.
Friday, August 27, 2010
082610 - Let's put some money to work!
“I work all night I work all day to pay the bills I have to pay”
I was speaking to a long time client today and we discussed “ideas”. He told me that because I had “ideas” I needed to work harder. As a conscripted servant how much harder could I work.? Apparently, into the night and more.
Lets look at current trade ideas that seem to work and do some analysis to justify their ownership. The list below are stocks that we like and meet our criteria for ownership. Each stock/trade has its own risk profile and you should carefully consider doing the trade relative to your own risk profile. I encourage everyone to do their own research and achieve their own comfort level for each and every trade idea. As always we have in place one, some, none or all the trades below in any of our client accounts.
The first group in BOLD I have provided trade analysis below.
I will process the remaining group in the next few days and provide analysis at that time.
I tried to list the Risks involved in doing each specific trade strategy. There are many risks as we all know. The greatest is that the stock price goes down. There are too many risks to list, so I listed the ones I thought about the most. Use your own judgment and investment skills. If there is something I missed let me know nicely. I believe all my numbers are correct, if you find an error it will prove just how human I am.
The options I show are the ones I like. You will notice that my horizon is very short term. There are a number of reasons for my short-term bias. Mostly, in the current environment, option premiums are day/dollar highest in the short term. Sounds interesting? Not really, because if I simply divide the premium, or amount of money I am paid to sell an option by the days to maturity, the most money per day is short term. Typically, I am not paid as much to go out further on the calendar. If I can continually earn more money in a one-month trade than say a two-month trade, I will do the one-month trade twice and earn more options premium.
Example: AJG spot price of $24.89/ - comparing selling calls twice two months in a row to selling a two month call
Selling two calls:
1) Today I buy AJG stock at $24.89/ and sell a one month Sept 25/strike call and earn 0.35¢ premium with a Stand Still Return (SSR) 1.41% un-annualized
2) The options I sold today will expire next month on Friday, September 17th
3) For the purpose of this example, on this day in the future the price of the stock is $24.89/ and the options expire worthless.
4) For examples sake let’s say that the price of the stock and the one months option on Monday September 20th are the same as they are today. The stock price is $24.89/ and the one month call’s earn 0.35¢.
5) So on this day, a month after I did the original trade, I now sell the current one month Oct 25 calls for the same 0.35¢ with a SSR of 1.41% un-annualized,.
6) I have now cumulatively earned 0.70¢ by selling identical calls two months in a row generating an un-annualized return of 2.81% for the two months.
Selling one call:
1) Today I buy AJG at $24.89/ and sell a two month October 25/strike price call and earn 0.55¢ premium with a Stand Still Return (SSR) 2.21% un-annualized.
2) Two months from now at expiration I have earned 0.55¢ in premium and generated a SSR of 2.21% un-annualized.
Summary:
When I sold the two calls I had to do an extra trade and employ some assumptions. The main assumption is that that the market for the stock and option stay unchanged. This strategy generated 40 basis points or 0.40% more then the second strategy on doing a two-month option. Clearly, the assumption that the market prices would stay the same is a big assumption. However, it is not the absolute price levels that are important but the relative price levels. Even if the prices of the assets (stock and option) change the impact is not as important as long as the ratio or SSR remains the same.
The list of potential stocks/trades is:
AJG
EPD
FL
LLY
MCHP
SCCO
WIN
ADP
ETP
FGP
APL
SYS
UVV
KO
PG
KMB
ABT
CVX
JNJ
AFL
STR
PH
CTWS
SMG
TMK
This represents a lot of work!
As a glutton for punishment (aka Portfolio manager) lets get going.
AJG - Arthur J Gallagher & Co.
Closing spot $24.89/
P/E 19.45 Forward P/E 15.65
Dividend 5.2% ex-date 09/28
Sept 25’s 0.35¢ SSR 1.41%
Return to call 3.25% / $25.35
Break Even $24.54/share
Oct 25’s 0.55¢ SSR 2.21%
Risks
The stock is trading at a 1.81% premium to the 52 day average
The dividend is missed
EPD – Enterprise Products Partners LP
Closing spot $37.14/
P/E 19.08 Forward P/E 19.05
Dividend 6.30% ex-date 09/28
Sept 37.00’s 0.65¢/ net 0.51¢ or SSR 1.37%
Return to call 1.37% / $37.65
Break Even $36.63/share
Sept 38.00’s 0.20¢/ net 0.20¢ or SSR 0.54%
Oct 37.00’s 1.10¢/ net 0.96¢ or SSR 2.58%
Oct 38.00’s 0.60¢/ net 0.60¢ or SSR 1.62%
Risks
The stock is trading near its 52 day top price
Debt
Weak margins
FL – Footlocker Inc
Closing spot $12.09/
P/E 24.62 Forward P/E 11.74
Dividend 5.10% ex-date 10/10
Sept 12.50’s 0.35¢/ net 026¢ or SSR 2.89%
Return to call 6.29% / $13.20
Break Even $11.74/share
Oct 12.50’s 0.60¢/ net 0.60¢ or SSR 4.96%
Risks
Retail stock……
Weak operating margin
High P/E
Weak profile to “competitors”
LLY – Ely Lilly & Co.
Closing spot $33.95/
P/E 8.40 Forward P/E 7.66
Dividend 5.80% ex-date 11/11
Sept 34.00’s 0.65¢/ net 0.65¢ or SSR 1.91%
Return to call 2.06% / $35.30
Break Even $33.30/
Oct 34.00’s $1.10/ net $1.10 or SSR 3.27%
Return to call 3.42% /
Break even $32.84/
Risks
Drug company
MCHP – Microchip Technology Inc.
Closing spot $28.20/
P/E 19.04 Forward P/E 11.806
Dividend 4.80% ex-date 11/17
Sept 28.00’s 0.85¢/ net 0.65¢ or SSR 2.30%
Return to call 2.36%
Break Even $27.35/
Sept 29.00’s 0.40¢/ net 0.40¢ or SSR 1.42%
Return to call 4.26%
Break Even $27.80/
Oct 28.00’s $1.30/ net $1.20 or SSR 3.90%
Return to call 3.90%
Break Even $26.90/
October 29.00’s 0.80¢/ net 0.80¢ or SSR 2.84%
Return to call 5.67%
Break Even $27.40/
Risks
Growth of receivables
Neat top of 52 week range
SCCO – Southern Copper Corp.
Closing spot $28.48/
P/E 17.63 Forward P/E 10.67
Dividend 5.30% ex-date 11/10
Sept 28’s $1.30/ net 0.82¢ or SSR 2.88%
Return to call 2.88% / $29.78
Break Even $27.18/
Sept 29’s 0.80¢/ net 0.80¢ or SSR 2.81%
Return to call 4.63% / $29.80
Break Even $27.68/
Risks
Commodity price collapse
WIN – Windstream Corporation
Closing spot $11.18/
P/E 16.18 Forward P/E 13.63
Dividend 8.90% ex-date 09/28
Sept 11’s 0.31¢/ net 0.13¢ or SSR 1.16%
Return to call 1.16% / $11.49
Break Even $10.87/
Risks
High payout ratio
Debt
ADP – Automatic Data Processing
Closing spot $38.75/
P/E 16.11 Forward P/E 14.73
Dividend 3.5% ex-date 09/08
Sept 38’s $1.10 / net 0.35¢ or SSR 0.90%
Return to call 0.90% / $39.85
Break Even $37.65/
Sept 39’s 0.50¢ / net 0.50¢ or SSR 1.29%
Return to call 1.94% / $39.50
Break Even $38.25/
Oct 39’s 0.95¢ / net 0.95¢ or SSR 2.45%
Return to call 3.10% / $39.95
Break Even $37.80/
Risks
Looking for some – high beta?
Wednesday, August 25, 2010
082410 - REMAIN CALL ALL IS WELL / The VIX has risen / Selling in the money

Animal House 1978 - Chip Diller/Kevin Bacon
In the 1987 stock market crash, I saw the hands of one the most powerful men on Wall Street tremble as he pressed the keys of his Quotron – as the Dow fell from around 2,500 to about 1,750 – 10 days later, it rose above 2,000. Today we are over 10,000. Take a deep breath, markets go up and they go down.
Now is the time to decide if you are a trader or an investor. If you are a trader, STOP HERE and go somewhere else. You will not read anything here that is of interest to you. If you are an investor read on.
Breathe deeply; if you have not seen markets undulate wildly wait. If you have, let us move on.
Directional plays are difficult but we are in this for the long hall and our strategy works in all environments. Picking good stocks and working them for all we can is a strategy for wealth creation not instant wealth. The market movement is temporary and has created opportunity for us. Let us explore the possibilities.
The Vix has risen
It remains low compared to a few months ago but volatility is up for the past few months. At today’s close of 27.46, it is below the 52-week average of 31.72. Keep in mind this is the mathematical average and we can devise all kinds of fancy formulas to tell us what we already know by looking at these two numbers, the VIX is still relatively low for the past year. Keep in mind that the VIX, as previously explained, is an indicator and may not be representative of any particular stock that we would look at. Nevertheless, it is something, an indicator, in a world where information is not available.
Now let us progress to looking for ideas that we like. This is where we can express our fears and optimism in the market and for a particular stock. A good example is ADP. I will take you through some value prepositions and structured thoughts. It will be long-winded and boring for those only interested in doing a trade. This is the educational portion of the strategy and as I have written in earlier posts, an educated investor is our best customer. If you just want to trade, skip to the trading section below.
The folks at ADP provide a service and are in my mind basically an annuity company. They provide work for a fee and keep their clients forever. Boring but stable and profitable. Not too much excitement and they pay a nice dividend. The stocks 52-week range is 26.46 – 45.74. The current price of 38.81 is about an 8.0% premium to the 52-week mathematical average. The dividend is 3.5% next paid on Sept 8. Current P/E is 16.14 and the forward P/E is 14.76. So far so good. Furthermore, the analysts who count like the stock for the same reasons we do, it is boring.
Now I will give you two ways to play the stock. Markets goes up and markets goes down. Choose your scenario. Feeling lucky? Take the strike above the spot price. Feeling cautious? Take the strike below the spot price.
Selling calls above the spot or current price seems to be a more common practice than I ever thought. There is nothing wrong with doing this but I see it as an optimistic practice. Stocks go up and down. Nothing new. Selling out of the money calls or calls that are currently above the spot or current stock price allows for an expectation that the stock will go up in value. Nothing wrong with this view. I do not always like selling calls that are above the spot or current market price of the stock. I will explain why.
I have had an ongoing disagreement with one of my colleagues on selling in the money calls. These are calls with strike prices below the current spot or market price of the stock. The pricing of calls is a mathematical process that involves using two non-mathematical inputs, volatility and bid offer spread. These two items are sentiment driven and are priced based on what buyers and sellers are willing to pay for each or rather their opinion of value. When a stock is “in the money” to an option the instability of the option is dampened by the amount it is “in the money”. In this case the dampening amount is the 0.81¢/ the stock is in the money. This equates to 67.50% of the premium and 2.09% of the stock price. Let us take a close look using ADP.
ADP spot price 38.81/share
Price of September 38.00/ calls 1.20/
Price of September 39.00/ calls 0.60/
The 38.00 calls are “in the money” by 0.81¢/
The 39.00 calls are “out of the money” by 0.39¢/
The net receipt for the 38.00/ calls is 0.39¢/
The net receipt for the 39.00/ calls is 0.60¢/
The stand still returns (SSR) for each is:
September 38.00/ calls = 1.00%
September 39.00/ calls = 1.55%
Let us look at return scenarios:
In this example you will get 0.55% more by selling the out of the money calls. The question is why would you want to sell the in the money 38.00 calls? The answer is IF I am bearish and think the stock will decline in price I have a cushion of $1.20/ by selling the in the money calls where I only get a 0.60¢ cushion if I sell the 39.00/ calls.
If I sell the in the money 38.00/ calls my breakeven becomes 37.61/ or a decline of 3.10%. If I sell the 39.00/ calls my breakeven is 38.21/ or a decline of 1.55%. Therefore, selling the 38.00/ calls is a bearish tactic while selling the 39.00/ calls is somewhat bullish.
If I got called on the 39.00/ calls my overall return would be 2.55% broken down by income from the sale of the call of 0.60¢ or 1.55% stock appreciation of 0.39¢/ or 1.00%. Sure beats a poke in the eye by a sharp stick. However, the stock would have to appreciate in this crazy volatile market, and honestly the price to call is actually 39.60/. The reason for this is that the buyer of the option needs to cover the cost of the option premium of 0.60¢/ in order to call the stock away. If this happened, my overall return would increase by an additional 1.55%. Overall, not bad.
For the 38.00/ in the call option the price to call would theoretically be 36.80/. The reason if that the buyer of the call is willing to pay 1.20/. Therefore to call the stock they would have to earn back the premium they paid for the call. In this case their break even would be the strike price of 38.00/ minus the price p[aid for the call of 1.20/ or a net price of 36.80/ or a 5.185 decline from the current price.
Keep in mind that these two scenarios are not balanced. Sometimes they are and the risk reward profiles are compelling. Another factor is that ADP pays its dividend on September 8. At an estimated annual rate of 3.5% or 0.88% per quarter, this is also a factor. I would add this to my down side protection that would drive my breakeven lower by another 034¢/. Pricing theory tells us that the dividend is already reflected in the stock price. (I will let the rocket scientists explain that one!)
Personally, I would sell the in the money for ½ my position and the out of the money for the other half and look to dollar cost average.
Monday, August 23, 2010
082310 - Friday's expirations and opportunity
Friday’s options expiration created opportunities for us to look at this week. The end of week market uncertainty gave us higher volatility and created opportunities for our strategy. Lets take a quick look at what happened and how this works for us.
In my opinion, the markets are full of players who are an optimistic group and tend to have short memories. The abrupt softening of the market at last weeks end was not unusual. Participants these days are nervous and seem to be looking for the first sign of bad news to sell and good news to buy. Last week we saw buying on perceived good news at the beginning of last week and selling on perceived bad news at the end of last week. Given the jittery nature of market participants with all the buying and selling, somebody must be making a lot of money. Last weeks euphoria ended with Thursday’s unemployment numbers that overall were not surprising. As will be discovered, Census workers just got their “pink slips” and many had the ability to file for unemployment. Anyway the weekly unemployment numbers are unpredictable and in this environment the surprise would be if the were predictable. Our concern is not so much with the direction of the market but with the opportunities provided by the sideways or confined range of market activity. Certainly, the activity at weeks end gave us higher volatility to trade on.
Given that last Friday was options expiration day for the month, today we will get informed of what was and was not called. I like to view the Monday’s after expiration as a new investment day. A clean slate where we can look at our portfolio as if nothing were in it and start all over. Many of the positions in the portfolio stay provided they provide a favorable risk/reward profile. We also renew our search for new opportunities to add or re-establish old favorites that meet our criteria. We are under no obligation to keep or renew a position.
081610 - The VIX - This is not your Mother’s Vicks
The VIX - This is not your Mother’s Vicks
“VIX is the ticker symbol for the Chicago Board Options Exchange Volatility Index, a popular measure of the implied volatility of S&P 500 index options. It is not backed by anything and positions held are merely a prediction of a future. A high value corresponds to a more volatile market and therefore more costly options, which can be used to defray risk from this volatility by selling options. Often referred to as the fear index, it represents one measure of the market's expectation of volatility over the next 30 day period. The VIX Index was introduced in 1993 in a paper by Professor Robert E. Whaley of Vanderbilt University[1].” – wikipedia: http://en.wikipedia.org/wiki/VIX
Now that I’ve cleared that up, I’ll give you my version. VIX or volatility is a market indicator. Just as the S&P 500, NASD 100, etc. VIX is a general market indicator for options pricing. Like the market indices, the VIX can go up or down. Unfortunately, the volatility for options on a stock you are looking at may not even move with the VIX or worse it could move in the opposite direction to the VIX! It happens and the mystery is not so great. As the head of a trading room once told me, “prices go up because of an imbalance of buyers to seller and they go down due to an imbalance of sellers to buyers.” Shakespeare could not have said it better. Also, keep in mind that stocks and sectors get spooked and prices can change in these areas first leading or lagging the overall market.
Let’s forget the above and remember that the VIX is a good indicator to look at, even if it is the only indicator. The rule here is sell volatility over 28/buy volatility under 12. The problem is getting a volatility quote on and individual stock. If you really want to have fun, ask one of the boiler room guys who call you about options. They will wax and wane about their skills. When the opportunity arises, ask them, “What is the quoted volatility for GM?” Hint: GM at this writing does not have options. Anyway, it is nearly impossible to get a volatility quote on any individual stock option from a retail desk.
Back in 1973 two really smart guys named Fisher Black and Myron Scholes wrote a paper that became the basis for options pricing models. Volatility became one of the major components of their model and every options pricing model since then. Therefore, VIX is important and it gives you a very simplistic and generic idea of where volatility is priced. These models can be very simple and very complicated. Who has the better model? Who cares! We are not in this for getting the absolute best price for any single option. Option’s pricing involves the use of many dynamic variables like the spot price of the underlying stock, forward interest rates, etc. Things that individually can create real stress in trying to price correctly and in aggregate can drive you nuts or to write your own pricing model.
Overall, as an indicator, I find that a high VIX provides an indication that overlooked stocks may be attractive and a low VIX means nothing much looks good. Why is the VIX important? It is just another piece of information that an informed investor should be familiar with. Also, dropping the old VIX bomb in cocktail conversation is fun and who doesn’t want to be the life of the party?
081510 - Understanding this strategy / RIG / INTC / CAT / DE
Options expiration day will be this coming Friday, August 20, 2010. No doubt it is premature to jump into this strategy if you are not familiar or comfortable with it at this point. If your first exposure to this strategy is this blog, my suggestion is wait a while until you fully understand the strategy. Participating in an investment strategy you do not understand is a sure way to lose money. I advise my clients that if you don’t understand any strategy or are not comfortable with it, DON’T DO IT! Opportunities to make money come and go, be patient, no sense in chasing something you don’t understand. If you stay with my blog in time your comfort level will grow and you will be able to independently evaluate the trades and determine their suitability for your risk and portfolio needs.
The significance of expiration later this week is that sometimes opportunities present themselves that can be viewed as lower risk because they are offset with high rewards. The suggestions below present risk as do all investments. The short-term nature of the tactics is balanced by several considerations, among them: 1) these are stocks that we typically trade in, 2) specific stock option volatility is high, 3) special situation.
There are a finite number of stocks at any given time that the strategy works well with. By working well I mean the stocks pass the screens and have adequate fundamental profiles. These stocks can either be transient or long term “keepers”. By transient I mean they appear attractive within the confines of the rules of the strategy only one time. After that that they “fade” into obscurity again. Long term keepers are stocks that more than not have attractive elements for our strategy.
With one trading week to go until expiration any trade is risky. The fact that there is a high stand still return (SSR) means something is going on that represents risk, mispricing or both. Therefore, keep your eyes wide open. I typically limit these really short term trades to stocks I am familiar with and are comfortable owning.
Now let’s look at these few sample ideas that should make some money. As always these may reflect strategies that we may or may not have on at any given moment depending on what has been called, individual portfolio risk tolerance’s and a few other circumstances. The strategies are in no way one’s we would not be willing to do and have come about as we look to optimize our existing positions.
TransOceanic – RIG
Long Stock RIG at $54.15/share
Sell Call strike $55/share at 0.33¢/share
Stand Still return 1.83% un-annualized for 5 days.
Risks
law suits pertaining to BP spill.
No dividend payout
The stock is currently trading 2.12% the mid for its 52 week range
Intel – INTC
Long stock INTC at $19.15/share
Sell call strike $19.00/share at 0.39¢/share
Standstill return 1.25% un-annualized for 5 days
Risks
The stock is 10.25% below the mid for its 52 week range
Blow out earnings announced a month ago.
Volatile stock
Dividend was paid 2 weeks ago
Caterpillar – CAT
Long stock CAT at $68.01/share
Sell call strike $67.50/share at $1.55/share
Standstill return 1.53% un-annualized for 5 days
Risks
The stock is 17.24% the mid for its 52 week range
P/E is too high
Deer & Co. – DE
Long stock DE at 64.85/share
Sell call strike 65.00/share at $1.62/share
Standstill return 2.50% un-annualized for 5 days
Risks
Stock is at the top of its 52 week trading range
P/E is too high
081210 - Adding Alpha using covered calls - introduction
It seems every asset class today has nothing to offer except volatility and disappointment. A few years ago, I advised clients who needed security and did not have market or risk management skills to put their money in a coffee can, bury it in the backyard or stuff it in the mattress. Chasing yield for income is never a good idea and many people got themselves into trouble buying seemingly cheep assets that are now expensive lessons. Their savings accounts have withered under the weight of such well paying but bust bonds of companies such as CIT and AIG.
As perverse, as it seems our strategy on advised accounts began to rely on one of the oldest management strategies – covered interest arbitrage. Sounds exotic? It really is not since it is only buying common stock and selling call options against it. There I said it – OPTIONS. Simple plain vanilla listed calls, not the rocket scientist’s of Wall Street kind that blow up every 7 years. If you are looking for Collars, Backspreads, Straddles or Going Naked stop reading now. There is nothing sexy about this strategy and everyone keeps his or her clothes on.
This strategy is actually the first true investment strategy I learned on Wall Street some 20+ years ago.
The process is simple and time tested: buy a stock and sell a call against it to earn premium. The details are important and change based on the investors needs in relation to risk and taxation. I can address the expected risk but the tax implications are between you and the IRS.
We began using this strategy in earnest several years ago in a Trust account that had an income beneficiary and remainder men. The income generated was not enough to provide the beneficiary with the amount of money they needed on an annual basis, as yields were too low. This resulted in the prospect of disbursing principal at the alarm of the remainder men. As is typical there is a natural tension due to the opposed nature of the interest of these two types of recipients. In order to address both their needs we embarked on a strategy of buying income producing (dividend paying) stocks and selling calls (for additional income) against the positions. The dividends when combined with the premium received from selling the calls was classified as income for the purpose of distribution and the result was preservation of principal when making distributions. All this meant was that in the end everyone was happy. I used italics because this gobbled-e-gook is important. Generating additional income, making more money, adding alpha, was our goal and it we achieved it.
I have taught this method to several old time investors as well as some youngsters. I have been fortunate enough to have gone to options trading school in Chicago and keep copies of Options as a Strategic Investment and Options Volatility and Pricing Strategy in my book shelf, they remain dusty as this simple strategy is best kept….. simple. Examples work best so here it goes:
Buy Stock CAT (Caterpillar) $67.50/share
Sell Call 08/20 strike $67.50/ $ 1.45/share
SSR (Stand still return) 2.15% u/a (Un-annualized)
Pricing based on the close of August 12, 2010
The SSR is simply the return if nothing happens but time moving forward - on options expiration day the price of the stock is the same as it is today. The return is unanalyzed because if annualized it would be over 150% and that is unrealistic. Remember we are simple folks doing a simple time honored tradition of making money. Several questions should come about and I’ll address some of the them today and others as we get to know each other better.
We use rules and stick to them based on the type of account. Low volatility accounts require some initial screening for: 1) payment of a substantial dividend, 2) a P/E that falls within reason, 3) stability of price and 4) large “stable” capitalization. As this is an income replacement strategy caution is necessary. It is important that the underlying stock is one we like for fundamental reasons in addition to its stellar technical qualities. After our screens find the initial stocks, we then look at the fundamentals. The options profit profile is the last cut and does not always work or remain attractive. Nevertheless, we do know we have a stock we like and can justify on a fundamental basis and offers additional income opportunity.
Looking a little closer at screening items 1 & 2 above, when it came to P/E (price earnings ration) my finance professor, Darrol J. Stanley, used to say buy under 18 sell over 28. At least that is what I remember from Business School and I am sticking to that rule. In this environment, P/E is problematic and sometimes I have to rely on the forward P/E. As with any indicator, it has its flaws but generally, P/E serves as a good “headline” statistic. The same can be said of the dividend. My friends who bought BP are still in shock as are too many pensioners. Dividends can change when a stock is at $20/ paying 2.5% or 0.50¢/dividend share is not the same when the stock is trading at $60/share or 0.83%. However, 2.5% is still 135 basis points over 3 month T-bill and 200 basis points over the 2 year Treasury while 0.83% is 68 basis points over the 3-month and 30 over the 2 year.
As for the other two items, pricing, term of option, in the money, etc, etc, well we can deal with that in the next postings.
Until then,
Send your comments, ideas and chump change to me at: AddingAlpha@consultant.com
Subscribe to:
Posts (Atom)