09/02/11 - BG, CAT, DE, INTC, JNJ, KMP, MSFT, PG, RIG, SFL, STLD, UTX & WIN
At the time of this analysis, we used the closing prices of 09/02/11.
The VIX was 33.92
The S&P 500 was 1,173.97
This list is a review/update on the August 12th list of the same names. Below the stock listing with comments is the performance data to date as part of an evaluation of our strategy with thie group of stocks that we happen to really like. Keep in mind that although we write for the short term, the true value of an investment strategy is long term performance. That said, our long term performance is very good as is evidenced by our performance since the end of 2003. Copies of the portfolio performance are available upon request.


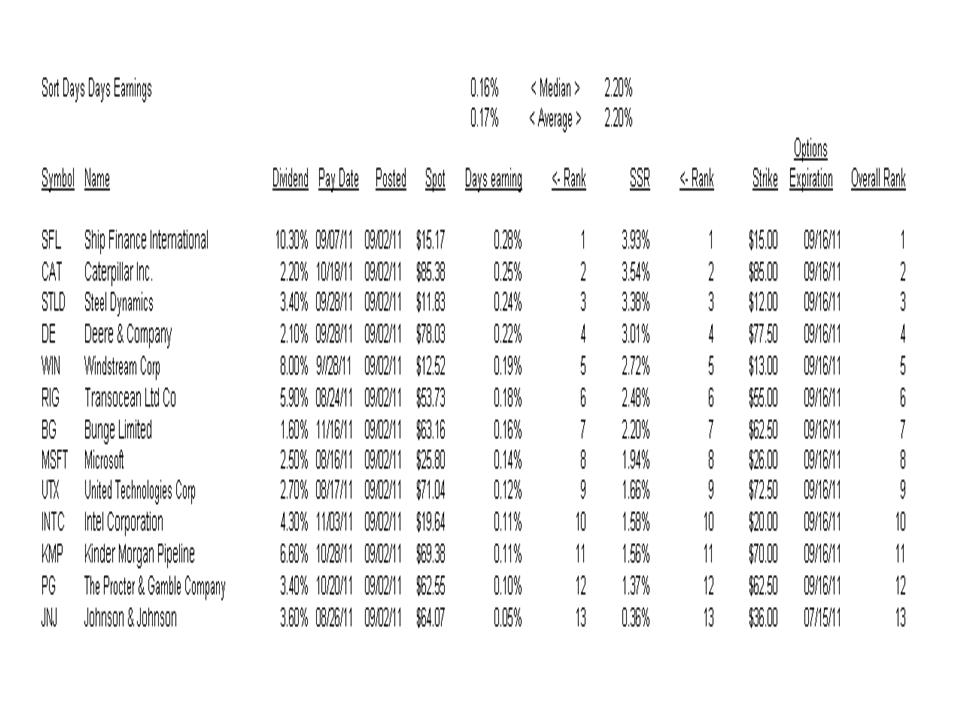
Symbol Name
BG Bunge Limited - Fun to pronounce and profitable to own, BG performed right on the portfolio average for the period at 4.6%. We continue to like BG's sector and BG in particular, RVI's and P/E's remain low and attractive.
CAT Caterpillar Inc. - Ranked #2 overall and in SSR and Days Earning for the 09/02 analysis. Performance was below average for the period, however, CAT has low RVI's and a decent dividend at 2.2%.
DE Deere & Company - Ranked #4 overall and in SSR and Days Earning for the 09/02 analysis. The period return was 10.4% - RVI's remain low, P/E's are good and the dividend is ok.
INTC Intel Corporation - Worst performer of the group at -3.6% for the period and #10 for the 09/02 anaylsis. We continue to like the INTC as it has low RVI's and P/E's and a high dividend.
JNJ Johnson & Johnson - Produced a +3.9% return including the dividend for the period. Performance was below the average but still very good. JNJ is ranked last in the 09/02 group. RVI's are high ranging from 62-71%. Implied options volatility appears to be low but we like the stability of the stock and its attractive P/E's and high dividend.
KMP Kinder Morgan Pipeline - A bottom dweller of this steller group of stocks - Performance was twice the indices at 0.7%, but the high dividend and mid RVI's are attractive, albeit the outragious P/E's are an issue. We like energy service stocks and the fact that tolling fees are akin to annuities similar to power generation facilities.
MSFT Microsoft - The +4.8% return for the period is on average for the group, RVI's are low, the dividend is good at 2.5% and P/E's are great at 9.6-8.2. Who would have ever thought MSFT would be an attractive dividend stock?
PG The Procter & Gamble Company - +5.9% period return, Mid range RVI's , 3.4% dividend, mid range P/E's - nothing fancy just a solid performing stock.
RIG Transocean Ltd Co - +5.5% return for the period with a dividend (5.9%!). RVI's are below 17, the current P/E is crazy but we give way to the forward P/E. As explained with KMP we like the energy service sector. RIG has yet to find its footing after the Gulf spill. This only appears to add to implied volatility.
SFL Ship Finance International - The +16.5% return for the period reflects the markets unsure view of SFL. We continue to like the stock and its profile, low RVI's and P/E's, high dividend and #1 overall ranking of this group.
STLD Steel Dynamics - -2.6% period return is a concern as overall economic conditions may be weighing on this stock. STLD is ranked #3 in this group and has low RVI's (around 10), low P/E's, and strong dividend.
UTX United Technologies Corp - Performance was at the group average (with a dividend), RVI's remain low as do P/E's. We like their sector and portfolio of businesses.
WIN Windstream Corp - +7.7% for the period and ranked #5 overall. Win has mid RVI's, ok P/E's and a high dividend. We like their sector.
| 08/12/11 | Portfolio performance review a/o | 09/02/11 |
|
|
|
|
|
|
| Average | 4.6% |
|
|
|
|
|
|
|
|
|
| Median | 4.7% |
|
|
|
|
|
|
|
|
|
|
|
|
|
|
|
|
|
|
|
|
|
|
|
|
| Symbol | Name | Dividend | Pay Date | Posted | Spot | 08/19/11 | Premium | Dividend paid | 09/02/11 |
| Return |
|
|
|
|
|
|
|
|
|
|
|
|
| BG | Bunge Limited | 1.70% | 11/16/11 | 08/12/11 | $61.60 | $59.92 | $1.30 |
| $63.16 |
| 4.6% |
| CAT | Caterpillar Inc. | 2.20% | 10/18/11 | 08/12/11 | $87.25 | $79.97 | $2.99 |
| $85.38 |
| 1.3% |
| DE | Deere & Company | 2.40% | 09/28/11 | 08/12/11 | $73.48 | $69.01 | $2.12 |
| $79.03 |
| 10.4% |
| INTC | Intel Corporation | 4.20% | 11/03/11 | 08/12/11 | $20.76 | $19.19 | $0.38 |
| $19.64 |
| -3.6% |
| JNJ | Johnson & Johnson | 3.80% | 08/26/11 | 08/12/11 | $63.44 | $63.14 | $1.83 | $0.57 | $64.07 |
| 3.9% |
| KMP | Kinder Morgan Pipeline | 6.60% | 10/28/11 | 8//12/11 | $70.48 | $66.25 | $1.62 |
| $69.38 |
| 0.7% |
| MSFT | Microsoft | 2.60% | 08/16/11 | 08/12/11 | $25.20 | $24.05 | $0.60 | $0.16 | $25.80 |
| 4.8% |
| PG | The Procter & Gamble Company | 3.60% | 10/20/11 | 08/12/11 | $60.45 | $60.96 | $1.45 |
| $62.55 |
| 5.9% |
| RIG | Transocean Ltd Co | 6.20% | 08/24/11 | 08/12/11 | $53.77 | $51.43 | $3.00 | $0.79 | $53.73 |
| 5.5% |
| SFL | Ship Finance International | 12.60% | 09/07/11 | 08/12/11 | $13.11 | $12.71 | $0.10 |
| $15.17 |
| 16.5% |
| STLD | Steel Dynamics | 3.30% | 09/28/11 | 08/12/11 | $12.66 | $11.42 | $0.50 |
| $11.83 |
| -2.6% |
| UTX | United Technologies Corp | 2.80% | 08/17/11 | 08/12/11 | $69.74 | $67.45 | $2.01 | $0.48 | $71.04 |
| 4.7% |
| WIN | Windstream Corp | 8.80% | 9//28/11 | 08/12/11 | $11.81 | $11.55 | $0.20 |
| $12.52 |
| 7.7% |
|
|
|
|
|
|
|
|
|
|
|
|
| S&P 500 |
|
|
| 1,178.81 |
|
|
| 1,173.97 |
| -0.4% |
| DOW |
|
|
| 11,269.93 |
|
|
| 11,240.26 |
| -0.3% |
Note: the tables shown are embedded .jpg files. This means that you can: 1) double left click them with your mouse to enlarge them, or 2) right click them with your mouse and choose to open them in a new window or tab, print, save, etc.As with everything we post, we may or may not have the stock and/or strategy in place in any one of our portfolios or may add it at any time. We do not make any buy or sell recommendations. We provide basic analytical research, some short commentary of the results and encourage you to do your own thorough due diligence prior to any purchase or sale.


