Tuesday, December 20, 2011

12/20/11 BWP FCX LINE SCCO SDRL SID VALE

BWP, FCX, LINE, SCCO, SDRL, SID & VALE


Closing values: S&P 500 1,241.3 and the VIX 23.22

We want to thank Sol Palha at Seeking Alpha.com for his article, "5 Magnificent Material Plays With Tempting Yields As High As 10.5%". This article provided his view on the names below. We are familiar with all the names except Seadrill and thank him for introducing us to the stock which is now part of our database.


BWP Boardwalk Pipeline Partners LP - lowest ranked of this group - the lacks an active options market thus we were only able to price two expri dates. Premiums were not particularly generious and both dates earn the dividend. RVI's are low to mid range and the P/E's are a little too high for us. However, the dividend at 7.8% is attractive.

FCX Freeport McMoRan - Ranked #3 overall - this ranking is driven by its Days earning. We do like this sector and most of the stocks in this analysis are mining related. This is a sector we have liked. Beyond high dividends they are an inflation hedge. Recent sell offs have provided buying opportunities but investor caution has muddled price movements. FCX has a low P/E and RVI's. Days earning is attractive (ignore the 1/21 note as it is based on old info - the real w/o div numver is much better at 17.3 bps/day.

LINE Linn Energy, LLC - LINE is ranked #4 overall. RVI's are mid high but the dividend is attractive and P/E's are good.

SCCO Southern Copper Corp - We have liked this stock and continue to like it. Stubborn or waiting for the value to be realized? The stock had performed well until the commodity sell off. Overall it is the #1 ranked stock of the group. RVI's and P/E's are low and the dividend is high. The w/o dividend note here is also wrong as the real number is 9.6 bps/day.

SDRL Seadrill Limited ORD - Thank you for this new name for our database - #4 overall - Noce looking stock although RVI's are mid high. Our concern with this and the other off shore stocks is currency risk. Granted the $/real rate has declined in favor of the dollar over the year. This type of currency exposure can be and issue and at this point we would prefer to reduce risk rather than add risk that we cannot accurately manage.

SID Companhia Sidrurgica Nacional - Lower down the overall list - RVI's are near the extremes, P/E is low and the dividend is high. There does not appear to be enough reward for the imbedded risks.

VALE VALE S.A. American Depository - Another Brazilian company we have liked. RVI's are way low as are P/E's. VALE is the #2 overall stock in this group and its profile is attractive. The question is currency exposure.


Note: the tables shown are embedded .jpg files. This means that you can: 1) double left click them with your mouse to enlarge them, or 2) right click them with your mouse and choose to open them in a new window or tab, print, save, etc.As with everything we post, we may or may not have the stock and/or strategy in place in any one of our portfolios or may add it at any time. We do not make any buy or sell recommendations. We provide basic analytical research, some short commentary of the results and encourage you to do your own thorough due diligence prior to any purchase or sale.


12/20/11 valuations - stocks are "CHEAP"

Stock valuations are attractive although the overall market is not.

Below we present some data in chart form courtesy of multpl.com.

Granted the historic periods are long, the information provides some prospective.

The S&P 500 (S&P) P/E ratio is at 20.17 versus a mean/median of around 16, or more than 20% above historic middle data. This is an indication that the market is "cheap" to the past 15 years but "rich" to the historic data (text in red updated post publication for clarity).

S & P 500 PE Ratio
S&P 500 PE Ratio Chart


S&P500 12-month earnings per share — inflation adjusted, constant November 2011 dollars. This number is huge! Again an indication of value in the market.

S&P 500 Earnings
S&P 500 Earnings Chart


Although chart followers will see the obvious issues with the following, we are at a low level. Without getting into the problems and discussions of "inflation", the S&P is again "cheap" to the past decade and 1/2.

S&P 500 Price, Inflation Adjusted
S&P 500 Price, Inflation Adjusted Chart

Dividends are key to our investment approach. As with the inflation adjustment above, the S&P is "cheap" relative to the past 15 years. When looking at this data, it is important to view dividend yield to an alternative, in this case Treasury yields.

S&P 500 Dividend Yield
S&P 500 Dividend Yield Chart

Although our timeline is short when we enter into a trade, in this case we are looking at stock yields versus bond yields. Comparing stock yields to the 10 year Treasury is appropriate because each represents a long term horizon. There are many theories on the how to value stock yields, we prefer to accept that they represent current value and that the stocks we buy are represent a group that demonstrate stability. This stability is intended to mean stocks that have been around for a long time and are in stable mature industries. 10 years therefore seems about right. Bell weathers of the past such as Kodak, GM, Citigroup have been replaced after a period of time, We see 10 years as "about right" for an average stock to perform at a level of stability.

With the S&P yield at 2.10% and the 10 yr at 1.8%, all seems good on a historic basis. A quick read tells us that mid/med for the S&P has been 4.3% while the same for the 10 yr has been 4.2%. This means that the S&P is "cheap" or conversely bonds are rich. Either way, stocks have value in them on a yield basis.

10 Year Treasury Rate
10 Year Treasury Rate Chart


The conclusion is that as difficult as it is to leave cash, the stock market is "cheap".

On a reciprocal basis, the VIX is at 24. Recently, we have written several times about the VIX valuation on a historic basis. Although 24 is not the high end of the recent range, it is high on a historic basis.

In conclusion, stocks are "cheap" on any number of basis. The biggest challenge we have is getting over the recent market volatility and putting cash to work. This is something we will begin doing in the next few days. We will first evaluate the results of last Friday's options expri and begin looking at our portfolios from a vantage point of what we would like to own versus what we do own. Going into year end it appears our current overweight cash position will be significantly reduced.

Friday, December 9, 2011

12/09/11

The VIX has risen!

The chart below is 5 day activity for the CBOE market volatility index.
It has been increasing as investors have become concerned about several issues that stand to have a significant impact on the market's performance.

The issues are many and include Black Friday sales, Euro zone debt problems, rating agency actions, continues poor economic data.

The post Black Friday bounce did not prove sustainable and seemed to be propelled by panic buying of stocks by underweight investors. Indeed the rally was impressive and the post rally decline appears to be fitful as reluctant investors do not want to get whipsawed.


5 day chart of VIX to SPY / volatility to market prices


Above we compare the VIX to the S&P 500. Looks like they are negatively correlated.


Yet today's chart shows less correlation.

Odd how these things work.

We see the VIX is a measure of investors appetite for risk.
It is not a perfect hedge for the market.
This is something we have written about a number of times.
Currently, investors have priced risk into the market as expressed by the high level of the VIX.
We wrote about this last month in our study on the level of the VIX and risk pricing.

Fears in the market place are real and as we move toward year end there is the ever present issue of "window dressing."
Is it possible that cash is the best thing to hold to impress investors?

We have been sitting on cash and struggling with the question of being market timers.

Clearly this is not what we want to be, but our concerns seem to be warranted and the price action has rewarded us over the past several weeks.

The last time we felt like this was several months ago.
As we often do, we priced up dozens of trades and were compelled to take positions as the rewards were too compelling.
At this point we are struggling to price up trades a few days prior to expri but will force ourselves to do so because that is our job.

Perhaps there will be opportunity.

Monday, December 5, 2011

12/04/11 - AA, ABB, ADP, APD, APL, BHP, CAG, CAT, CF, CLX, COP, CPO, CTL, CVX, D, DBD, DCI, DE, EAT, ETN, INTC, JNJ, POT, RAI, RRD, SCCO, TAP & UVV


AA, ABB, ADP, APD, APL, BHP, CAG, CAT, CF, CLX, COP, CPO, CTL, CVX, D, DBD, DCI, DE, EAT, ETN, INTC, JNJ, POT, RAI, RRD, SCCO, TAP & UVV

So the question is how did we fare in last weeks rally?
We re-analyzed about 1/3 of last weeks stocks for today.
Only two stocks had a negative return, CTL and UVV. CTL paid a dividend right after the analysis. The issues weighing on UVV's are a little less clear.
Keep in mind that when a stock "falls" from the top, the typical reason is that it has out performed. We did have to adjust strike prices higher on some of the names.


Symbol Name
AA Alcoa Inc - remains within the overall top 5 of both weeks lists. RVI's are below 20 and the Days Earning are huge.

ABB ABB Ltd - fell toward the mid in the current list - RVI's are below 30 and the Days Earning are above 10 bps/day.

ADP Automatic Data Processing, Inc. - RVI's have moved up and the stock has fallen toward to bottom of the group.

APD Air Products & Chemicals Inc. - Remains in the top 6, RVI's are below mid with the Call at 57%. Near date Days Earning are at 30bps/day.

APL Atlas Pipeline Partners LP - remains in the mid of the group. RVI's are high with all three value around 80%.

BHP BHP Biliton Limited - Remains near the top. No surprise given the questions around precious metals and inflation. The stock is volatile and RVI's remain low in the 30's.

CAG ConAgra Foods, Inc - #1 overall in this group. Considering the issues related to crops and forecasting no wonder! RVI's are fair valued and Day's earning are very high.

CAT Caterpillar Inc. - RVI's around 60% are mid-high while Days earning are 18bps/day at the near date.

CF CF Industries Holdings, Inc - #2 overall and just as high last week. RVI's are 30-40% and Days earning are 31bps. We like this sector and stock but understand the issues related to crops is a problem. P/E's are low but caution is warranted.

CLX The Clorox Company - Low RVI's and high P/E's. The stock is offering a SSR of 1.4% for 12 days. Suprising.

COP ConocoPhillips - Our analysts priced this one wrong so we will pass on it until we get better data.

CPO Corn Products International Inc. - So much for unknown and counting issues. The RVI's are 60-80% with low P/E's and Days earning at 11 bps/day. CAG and COP have performed about the same over the past year, but CAG represents the more attractive buy of the two at this point.

CTL CenturyLink, Inc - Low RVI's and P/E's. Days earning at 13bpd/day.

CVX Chevron Corp. - High RVI's and low P/E. Days earning is below 10bps/day. Not too much to offer in this environment.

D Dominion Resources, Inc - High RVI's mid P/E's and not very exciting overall.

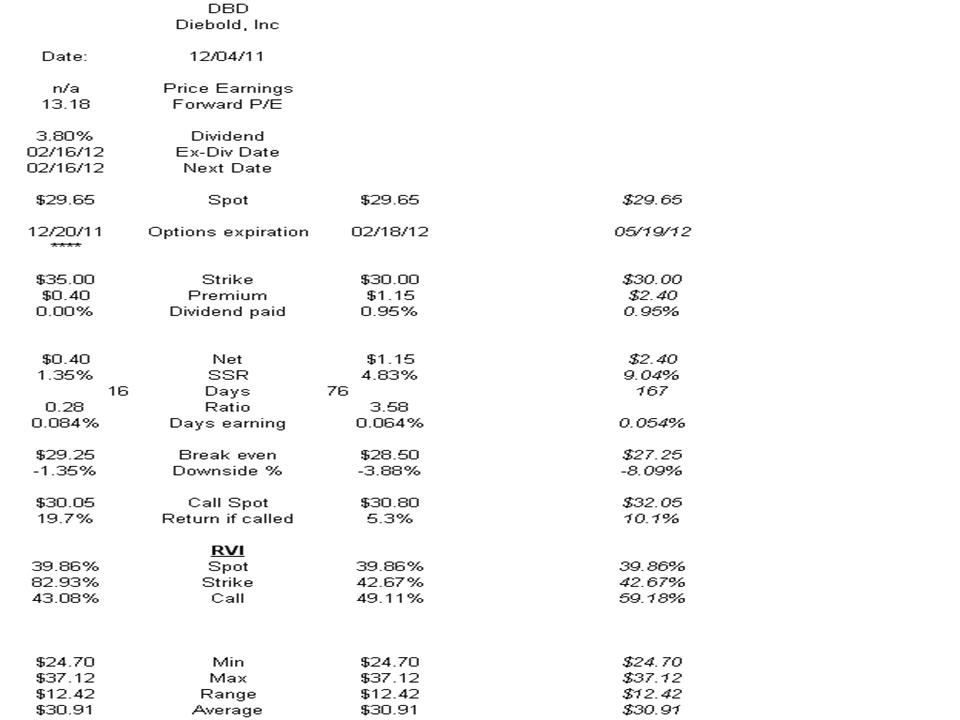
DBD Diebold, Inc - Another stock that is tough to quantify. It is at the bottom of the group and the numbers are not too compelling.

DCI Donaldson Company, Inc. - upper end of the group but RVI's are at the top end, P/E's are high. The earning profile is not compelling for the apparent risk.

DE Deere & Company - RVI's are mid range, P/E's are low and Days earning is at 20 bps/day. Dividend date is at the end of Dec, so take the early date and roll into Jan.

EAT Brinker International, Inc. - mid0high RVI's but a near ex date and low P/E's. Would be nice if there were 24 strikes to sell. The 25's are the best going so sell the near date and capture the dividend along with the 1.5% SSR should earn about over 2%.

ETN Eaton Corporation - RVI's are mid, P/E's are low and the Days earning is at 23bps/day. ETN is high on the list and very attractive.

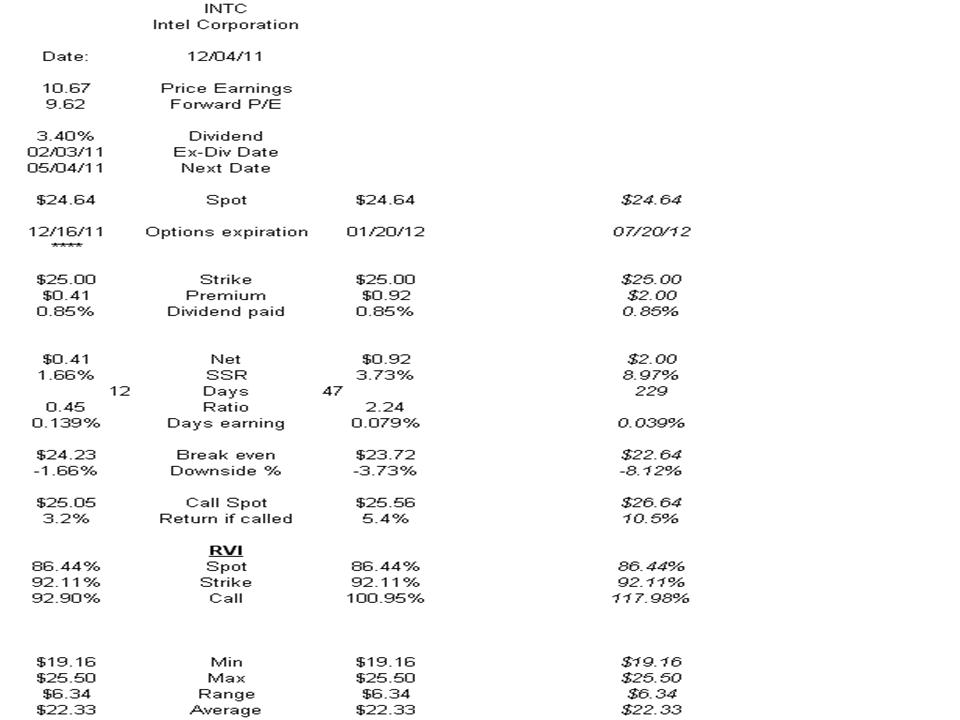
INTC Intel Corporation - High RVI's, low P/E's and Days earning just above 10 bps/day. We like the stock for a long term play understanding the volatility.

JNJ Johnson & Johnson - 2nd from the bottom of the group. How many ways can we say boring. RVI's are mid range, P/E's are good and the return profile is not very exciting. The Price range is just over $10 and the stock is mid range. Not very exciting, nut the call suggested is in the money.

POT Potash Corporation of Saskatchewan, Inc - #6 overall on this list. Much smaller CF has out performed POT for most periods except the past week. POT's data looks good with low RVI's and P/E's. Days earning is at 25 bps/day near and 11 bps/day just past the expected ex-date.

RAI Reynolds American Inc - Top end RVI's with an ex date this week. Days earning is near 20 bps/day and the call is in the money. We like this stock and the trade looks compelling if you do not mind being called.

RRD RR Donnelley & Sons Co - Low RVI's and P/E's. Days earning is over 20 bps/day.

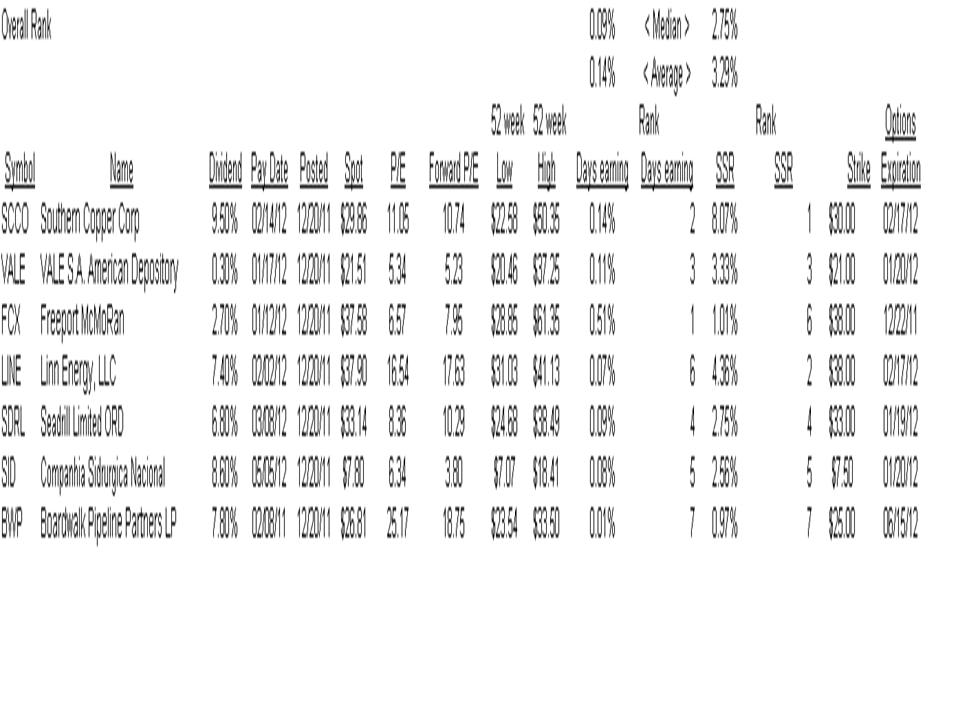
SCCO Southern Copper Corp - Low RVI's and P/E's. Days earning is over 20 bps/day. How is it everybody is stealing copper and these guys can not get their stock to rally?

TAP Molson Coors Brewing Company - Low RVI's and P/E's. Days earning is under 20 bps/day (10 bps). Not as exciting as the rest of the group but remember this is beer.

UVV Universal Corp Common - just over mid RVI's low P/E and a 4.5% div paying early Jan. Take the Jan trade and enjoy New Years!


The VIX was at 27.52 when we priced these trades.
Last week it was at 34.5 or 25% higher.
The S&P has increased 86 points or 7.4%

Needless to say the movements are not symmetric. Not surprising as risk is priced differently than the market. What does surprise us is that the World seems to be less safe today for investors than it was last week. Europe is more of a mess, the US is hopeless and Asia is in a funk. Granted we are approaching year end and portfolio managers may have panicked fearing an inability to gain window dressing at good prices. Most of the trades prices are compelling in their spot metrics. We like to believe compelling trades call out and most of the above with Days earning to the near date around 20 bps/day are screaming out "buy me"! This supports our near dated bias in these uncertain and volatile markets. Granted the JNJ's and CLX's look boring but maybe boring is the safest place for now.

Best wishes and happy investing.

As always we are willing to run your personal trade ideas through our model as long as our resources are available. You can contact us at Addingalpha@consultant.com


Note: the tables shown are embedded .jpg files. This means that you can: 1) double left click them with your mouse to enlarge them, or 2) right click them with your mouse and choose to open them in a new window or tab, print, save, etc.As with everything we post, we may or may not have the stock and/or strategy in place in any one of our portfolios or may add it at any time. We do not make any buy or sell recommendations. We provide basic analytical research, some short commentary of the results and encourage you to do your own thorough due diligence prior to any purchase or sale.